Properties, alerts, and defaults
When using the Dashboard Designer to create or edit a dashboard, you can configure a variety of property settings relating to layout, security, and alerts.
1.With the Dashboard Designer open, click File > New in the top menu bar.
If editing—Click File > Open, find a saved dashboard, and double-click it to open. In the dashboard header, click the ![]() icon .
icon .
2.In the Dashboard dialog, access the following tabs:
•General tab
•Title: Enter a title for the dashboard.
•Layout: Select a layout for how this dashboard will display in the design canvas. Each pane in the layout can contain one component. If editing—A new layout may add space for a component or drop off some content depending on the current arrangement and what you select.
•Security tab: Select Public (accessible to everyone) to enable others to see the dashboard.
•Linked Dashboards tab: If editing—You can link this dashboard (it must be saved first) to one of the component panes of a related dashboard. Expand the list, right-click a component, and select Add link. Search the folder structure for the dashboard you want to link to, double-click it to select, then click Close. Once this dashboard is linked, the ![]() icon will display in the headers of the related dashboard and component—click the icon to view and open this dashboard.
icon will display in the headers of the related dashboard and component—click the icon to view and open this dashboard.
•Alert Checks tab: Set up a dashboard alert to notify you when data-status changes occur at the dashboard or component level. For details, see "Dashboard alerts" below.
•Notes tab: In the blank space, type an optional note about the dashboard. When exporting a dashboard, added notes will also export.
3.Click OK, then click File > Save to save the changes.
Dashboard alerts
You can set up alert rules at the dashboard or component level. For dashboard-level alerts, Xtraction checks the rules for all displayed components; an alert action will occur if any one of the rules is breached. When set at the component level, Xtraction only checks the alert rule for that particular component.
You define and edit dashboard alerts within the open dashboard they're associated with. Saved alerts display on the Alerts list page. For details, see Alerts.
1.Open a saved dashboard in Dashboard Designer.
2.Click the ![]() icon on the dashboard header.
icon on the dashboard header.
3.In the Dashboard dialog, click the Alert Checks tab.
4.Expand the list and decide where you want to add the alert: at the level of dashboard or component. Right-click the item and select Add alert check.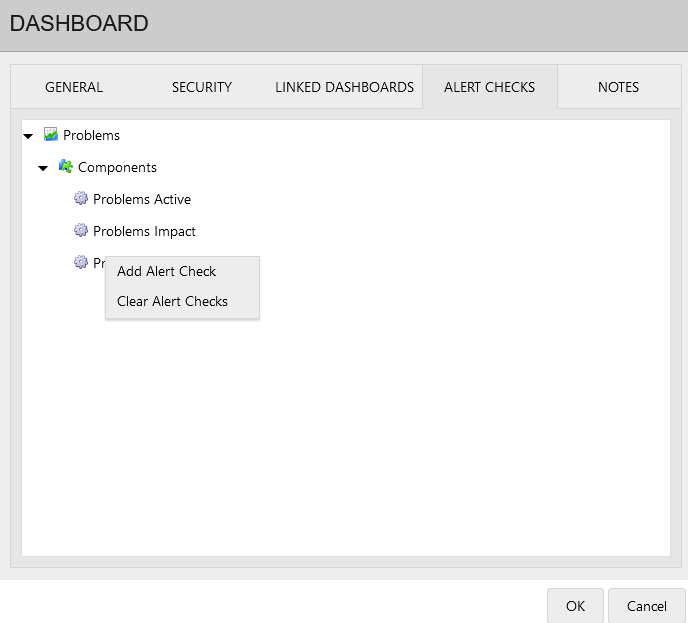
5.Define the alert by entering the appropriate properties:
•General tab: General information that's used to identify and classify an alert.
•Name: The title of the alert rule.
•Category: The category type for this alert rule (for example, Serious or Priority 1).
•Description: An optional description that more thoroughly explains this alert rule.
•After an alert notification: An action that's executed after an alert rule is breached:
•Continue: Resets the alert rule so that it's checked at its next trigger time.
•Delay: Delays the next alert check for a specified time period. The alert will continue to be checked after the delay period has elapsed. Enter a number and select the time interval (minutes, hours, days).
•Pause: Pauses the alert rule after it's breached. The alert will not be checked again until you manually resume it. Do so in the Alerts list page by right-clicking the alert name and selecting Resume alert.
•Trigger tab: The trigger controls when the alert will be checked. Currently, all trigger types are time based:
•Timer: The timer runs an alert check at a specified time interval (minutes, hours, days). Once the timer period expires, the alert is checked. Afterward, the timer resets and the cycle is repeated.
•Hourly: With an hourly trigger, you select the hours of the day that you want the alert rule checked. The alert is then checked at (approximately) the times selected.
•Daily: The daily trigger checks the alert rule at a particular time each day.
•Action tab: When an alert rule is breached, you can set up one of the following actions to occur:
•Email: An email is sent. Add a list of email addresses to send a message to when the alert breaches. Add a Subject line for the email; if left blank, the alert name will be the subject. Depending on the alert type, the Body is built dynamically and will include any text entered here, as well as any automatically generated text that's relevant to the alert breach.
•HTTP request: A URL is requested. This action sends off an HTTP Get request. You can include query-string parameters that enable the HTTP endpoint, for example, a web service, to perform specific actions. Use the following variables within the URL field to ensure the URL is dynamically built based on the context of the particular alert:
•{ALERT_ID}: The ID of the breached alert.
•{ALERT_NAME}: The name of the breached alert.
•{USER_ID}: The user ID of the owner of the breached alert.
•{DASHBOARD_URL}: A link to the dashboard associated with the alert (if applicable).
•None: When you don’t want to perform an action after an alert rule is breached, select this option. 'None' simply provides a breach history on the Alerts list page and records the breach value in the Xtraction database.
6.Click OK when finished, then click File > Save. Your new alert will display on the Alerts list page.
To remove an alert, open the Dashboard dialog > Alert Checks tab, right-click the alert name, and select Remove alert check. Click OK, then click File > Save.
Defaults
You can define several default options for all of your dashboards, no matter the data source, but in most cases you'll want to leave these options as they are.
1.Open the Dashboard Designer.
2.Click the ![]() icon in the navigation pane.
icon in the navigation pane.
3.In the Options dialog, select the following options for the open dashboard: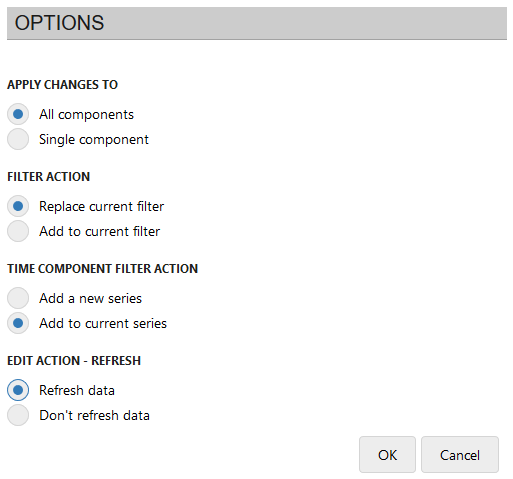
•Apply changes to: When applying standard or advanced filters, select whether to apply to all components in a dashboard or to a single component. All components is the default.
•Filter action: Select whether a filter action should replace the current filter on the dashboard or add to it. Replace current filter is the default.
•Time component filter action: For time components, select whether a filter action should:
•Add a new series: Create a new series for a dashboard with values generated by the filter. This is useful when you want to display separate values from within the same set of data.
•Add to current series: Adjust the existing dashboard with new values generated by the filter. This option is the default.
•Edit action - refresh: Decide whether to refresh the dashboard display automatically after every design action you take. Each refresh will re-query the data source, which generally is not a problem. Refresh data is the default. If processing time is too long, you can select Don't refresh data and manually refresh content by clicking the ![]() icon in the component display.
icon in the component display.
4.Click OK.